Save a chart to a file
Write one chart to an HTML page, an SVG image, and a PNG image.
Code
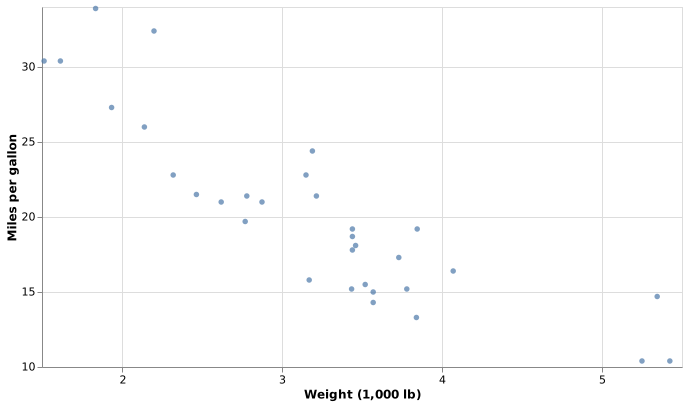
The chart plots weight against fuel economy for the 32 cars of R’s mtcars data, bundled with phiz as resources/data/mtcars.csv.
use Phiz\Datasets;use function Phiz\{aes, geom_point, ggplot, labs, size};$mtcars = Datasets::mtcars();$plot = ggplot($mtcars, aes(x: 'wt', y: 'mpg')) |> geom_point() |> labs(x: 'Weight (1,000 lb)', y: 'Miles per gallon') |> size(640, 360);// Drawn in the browser.$plot->save('chart.html');// Rendered by vl-convert.$plot->save('chart.svg');$plot->save('chart.png', scale: 2);use Phiz\Datasets;use Phiz\Plot;$mtcars = Datasets::mtcars();$plot = Plot::of($mtcars) ->aes(x: 'wt', y: 'mpg') ->point() ->labs(x: 'Weight (1,000 lb)', y: 'Miles per gallon') ->size(640, 360);// Drawn in the browser.$plot->save('chart.html');// Rendered by vl-convert.$plot->save('chart.svg');$plot->save('chart.png', scale: 2);Runnable script: save.php (PHP 8.5+) or save.chain.php (PHP 8.3–8.4).
Result
The SVG file:
The file extension picks the format: html (or htm), json for the Vega-Lite specification, svg, png, jpg (or jpeg), or pdf.
- HTML needs a network connection. The page loads vega, vega-lite, and vega-embed from the jsDelivr CDN and draws the chart in the browser.
Assets::inline()embeds the libraries for offline use. - Images need vl-convert. The vl-convert binary renders SVG, PNG, JPG, and PDF without a browser. Without it,
save()throwsVlConvertNotFound(Installing vl-convert). - Images are static. Tooltips and other interaction work only in the HTML file.
- Image size. An image has no page width to fill, so
size(640, 360)sets its plot area in pixels. Without it, Vega-Lite’s default size applies. - Reproducible SVG. With the same vl-convert version, the same specification gives the same SVG bytes on every run, except for unseeded jitter (Reproducible SVG).
See also: save() · size() · html() · svg() · png() · pdf() · Rendering